
March has marked another month of Express Entry draws, as Canada’s immigration system continues to invite candidates to apply for permanent residence (PR)
Certain trends continued through last month’s draws that may provide further understanding of how Express Entry may continue throughout the year.
Get a Free Express Entry Assessment
How does the composition of the Express Entry candidate pool influence score cut-offs and draw sizes?
While it can be difficult to understand how the make-up of the Express Entry pool impacts Comprehensive Ranking System (CRS) score cut-offs and draw sizes, there are a few basic trends that can be observed.
Distribution of scores and CRS cut-offs
The distribution of current scores within the Express Entry pool is one of the factors that may have an impact on the CRS score cut-offs of upcoming draws
CRS scores within the pool may help IRCC decide both what the next appropriate cut-off score is for qualified candidates, and how large each draw should be.
While there may be other factors in the decision-making process here (for example, labor market needs or special immigration policy), CRS distribution within the pool may prove to be a contributing factor even in these instances, as it is a key indication of how well-adapted immigration candidates are within the pool.
Category-based draws also impact this distribution
In addition to standard, CRS score-based draws, Immigration Refugees and Citizenship Canada (IRCC) conducts category-based draws for Express Entry candidates These draws specifically target individuals with certain professional experience, or language ability (instead of CRS scores), to meet labor market and demographic needs in Canada.
While these draws look beyond CRS scores, they still impact the distribution of scores in the Express Entry pool when they invite candidates. Thus, paying attention to these draws in analysis may prove useful.
What Express Entry draws occurred in March?
March saw four Express Entry draws throughout the month.
Two of these draws were general draws, which invited candidates from all three Express Entry-managed programs who met the needed CRS cut-off. Cut-off scores have remained higher than last year; however, this is not uncommon towards the start of the year, with cut-offs historically lowering for general draws as the year progresses.
The two other draws were category-based selections for transport occupations and French language proficiency. This marked the first transport occupations and the third French-language proficiency draw of the year. Thus far the federal Express Entry system has been inviting French-speaking candidates to apply for PR at a faster rate than Quebec’s immigration system, with these draws featuring some of the lowest CRS score cut-offs in Express Entry’s history.
More draw information is included in the table below.
| Draw date | Round type | Invitations issued | CRS score cut-off |
|---|---|---|---|
| 12-03-24 | General | 2,850 | 525 |
| 13-03-24 | Transport occupations | 975 | 430 |
| 25-03-24 | General | 1,980 | 524 |
| 26-03-24 | French language proficiency | 1,500 | 388 |
The current state of the Express Entry pool—March 2024
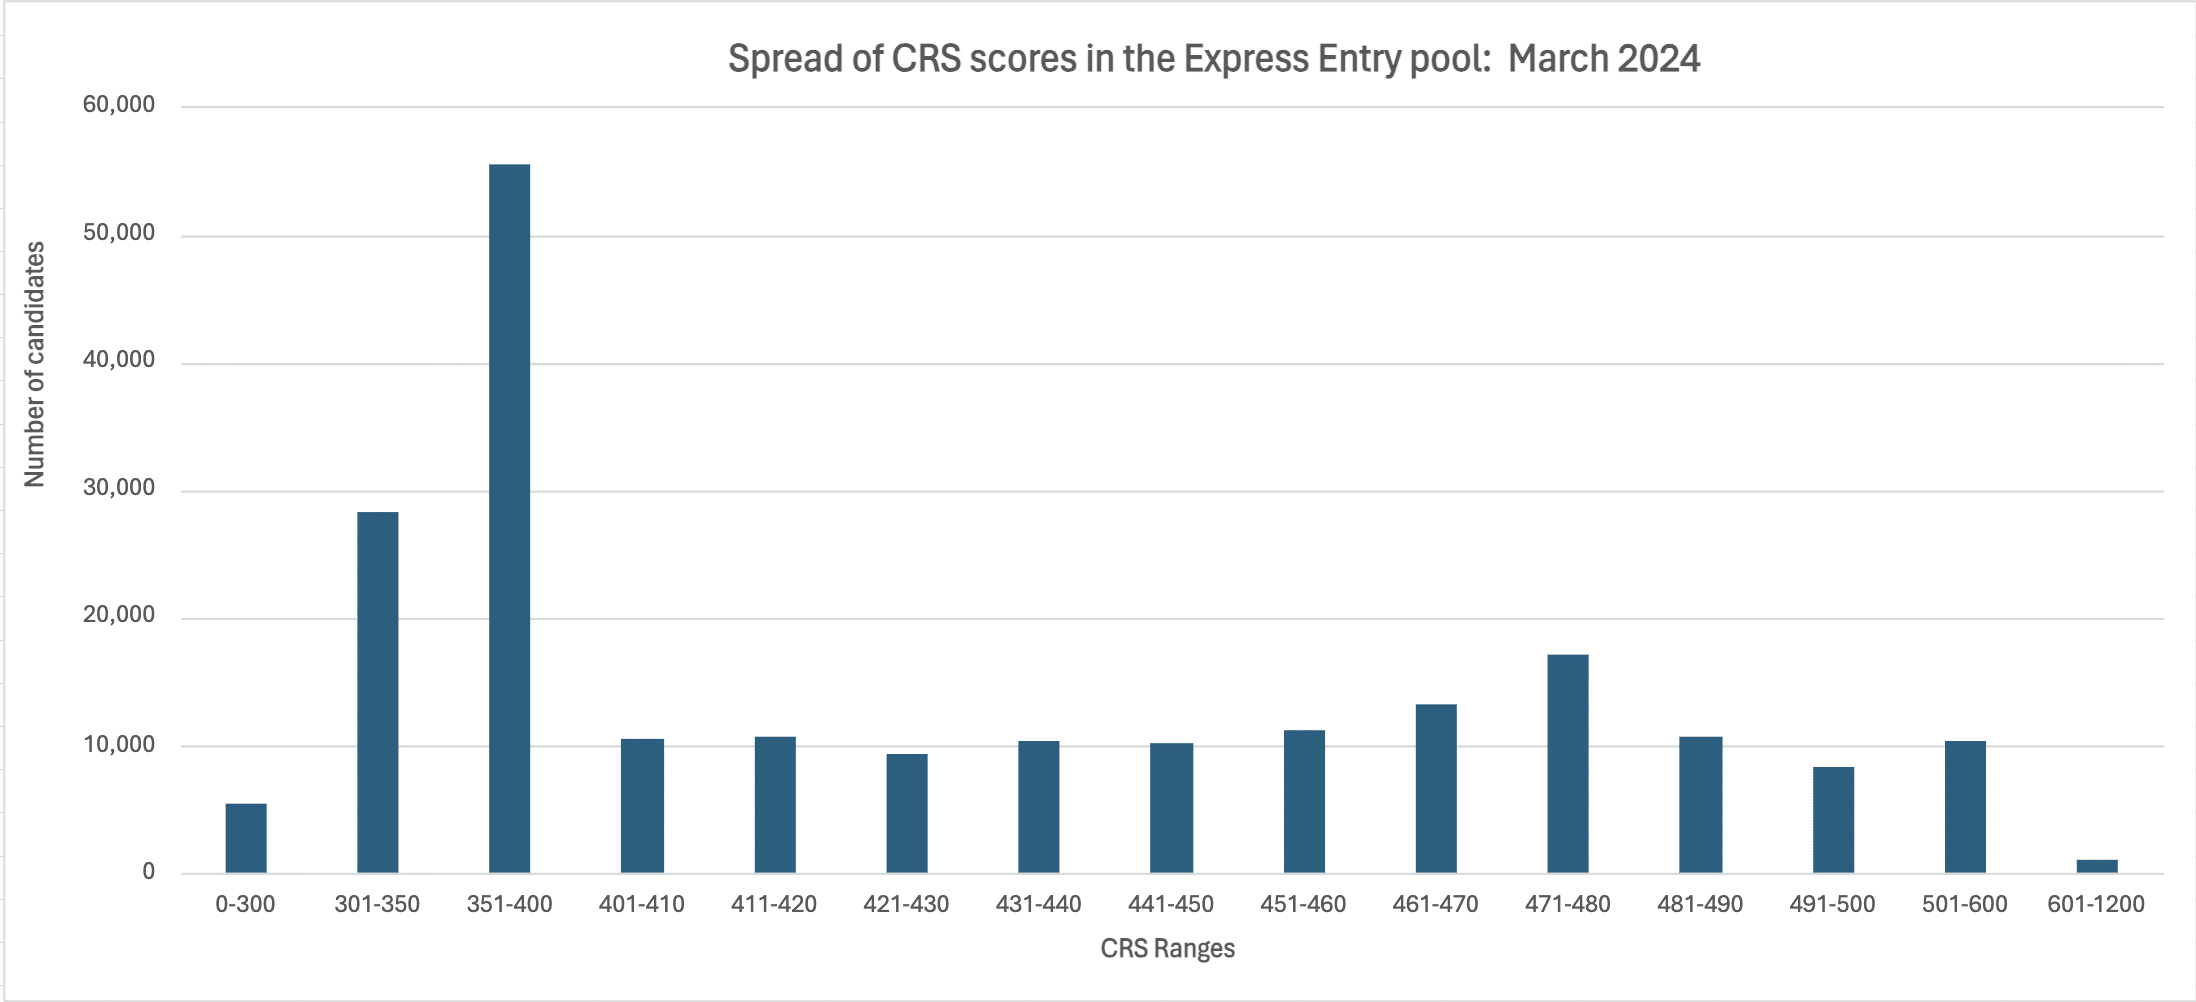
The Express Entry candidate pool now has a total of 211,944 profiles, showing a slight increase of roughly 700 profiles from the total number at the end of February. Score distributions have been maintained at roughly the same volume, with slight changes based on how many candidates entered within a specific score range. A complete table of score distributions and number of people in the pool can be found below.
| Score Ranges | Number of candidates |
|---|---|
| 0-300 | 5,390 |
| 301-350 | 28,287 |
| 351-400 | 55,586 |
| 401-410 | 10,495 |
| 411-420 | 10,610 |
| 421-430 | 9,296 |
| 431-440 | 10,309 |
| 441-450 | 10,172 |
| 451-460 | 11,188 |
| 461-470 | 13,218 |
| 471-480 | 17,105 |
| 481-490 | 10,683 |
| 491-500 | 8,294 |
| 501-600 | 10,324 |
| 601-1200 | 987 |
These scores have also been mapped out below to better visualize the pool. As we can see the highest volume of scores sit between the 351-400 CRS points boundary.
What percentile is your score in the pool?
By taking the upper boundary of each score range, we can also determine what percentile a score is in when compared to the rest of the scores in the Express Entry candidate pool.
Percentiles show how a certain score compares against the total make-up of scores. For example, if someone has a CRS score of 420, their percentile score is 52.07%—meaning that their score is higher than 52.07% of the total scores in the pool.
Find the complete breakdown of score percentiles below:
| Score | Percentile (%) |
|---|---|
| 300 | 2.54 |
| 350 | 15.89 |
| 400 | 42.12 |
| 410 | 47.07 |
| 420 | 52.07 |
| 430 | 56.46 |
| 440 | 61.32 |
| 450 | 66.12 |
| 460 | 71.40 |
| 470 | 77.64 |
| 480 | 85.71 |
| 490 | 90.75 |
| 500 | 94.66 |
| 600 | 99.53 |
| 1200 | 100 |
Express Entry,canadian experience class,comprehensive ranking system,CRS,CRS score,Federal Skilled Trades Program,Federal Skilled Worker Program
Lien source Click below
Here